Natural Resources Assessment
As a part of our Locally Led Conservation Planning process, conservation districts are advised to complete a Natural Resources Assessment. Conducted every few years, this assessment seeks to record the unique natural resources in our area and the types of resource concerns present.
Assessing the local natural resources assets and conditions is one of the core statutory responsibilities of Vermont Natural Resources Conservation Districts. NRCD's use these assessments to build work plans and develop programming. The process facilitates the identification of conservation projects from data collection to development and implementation, addressing natural resource concerns in the county.
In preparation for our Locally Led Working Group meeting in 2025, we updated some of our Natural Resource Assessment. Here are the highlights.
Points that stand out:
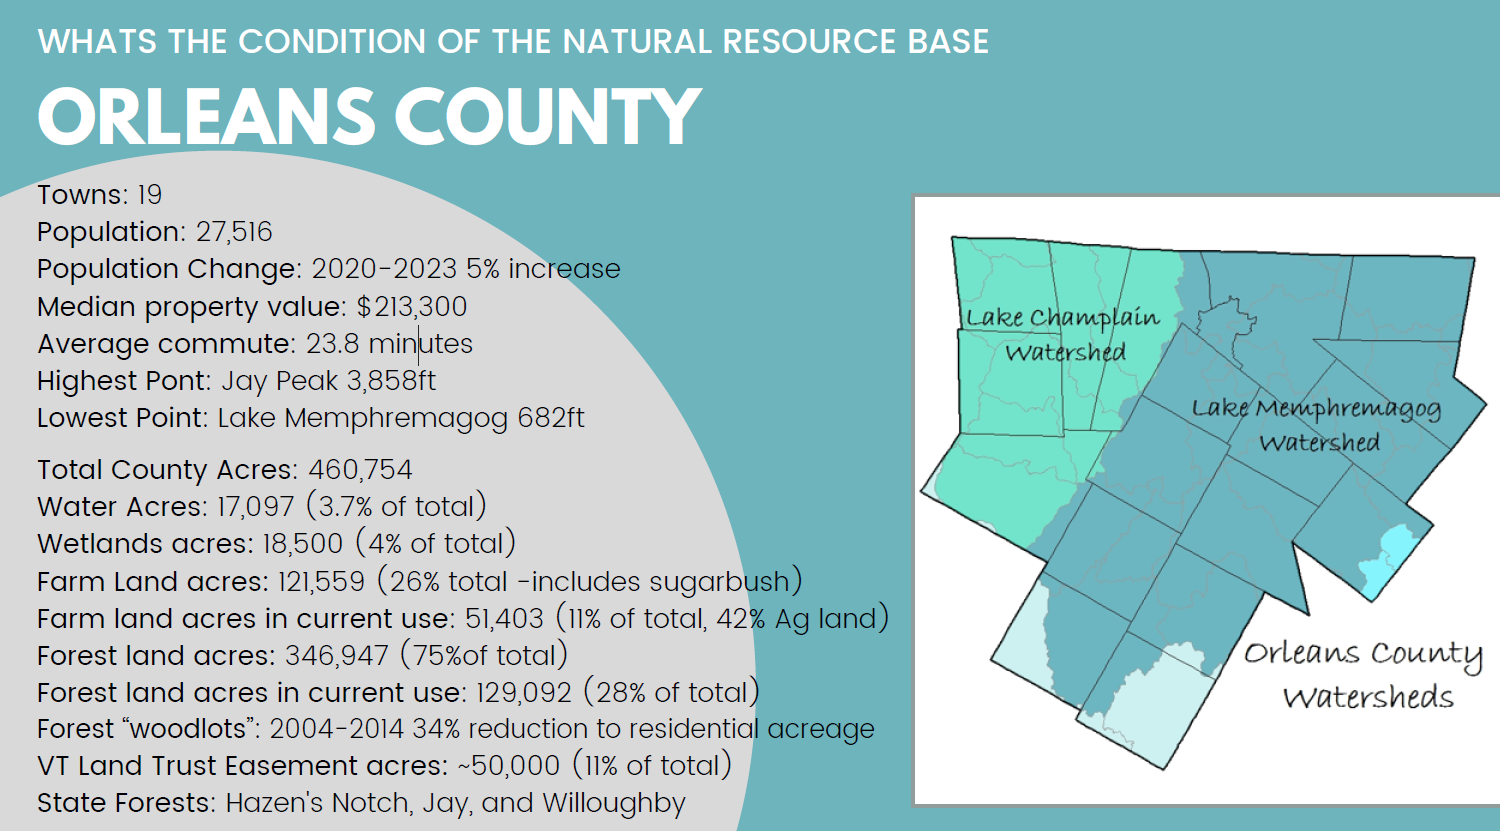
-- Population: 5% increase - Development as a resource concern.
** Need more TA programs and services for new landowners.
** Need more connections and work with the real estate community.
-- We drive a lot - we are strapped for time, less likely to engage
-- We have more carbon pollution.
NOTE:
--Land base numbers the data sets where these numbers came from are not apples to
apples... but this is to give you a sense of the counties land use.
-- half of the ag acreage is in current use.
-- most of the county is forested.
-- Forests are changing from woodlots to residential landbase.
Points that stand out:
Soils
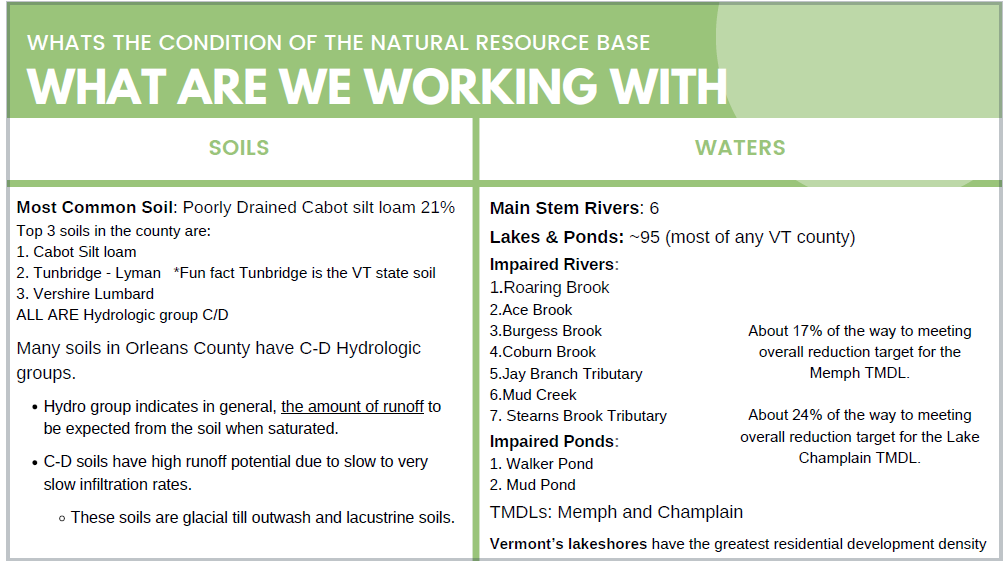
-- Cabot and Vershire, along with many other soils in the county, are C and D hydrogroup soils.
Hydrodrogroups - this relates to the soils infiltration ability which indicates the amount of runoff.
-- We are a wet county with high runoff potential.
Water
--6 main stems, including 2 Canadian river watersheds in Derby & Holland.
--We have the most amount of lakes than any other county in VT.
--7 impaired rivers
--2 impaired ponds
--2 TMDLs which Ben Capans reports % of the way to targets.
Soils
-- Cabot and Vershire, along with many other soils in the county, are C and D hydrogroup soils.
Hydrodrogroups - this relates to the soils infiltration ability which indicates the amount of runoff.
-- We are a wet county with high runoff potential.
Water
--6 main stems, including 2 Canadian river watersheds in Derby & Holland.
--We have the most amount of lakes than any other county in VT.
--7 impaired rivers
--2 impaired ponds
--2 TMDLs which Ben Capans reports % of the way to targets.
Points that stand out:
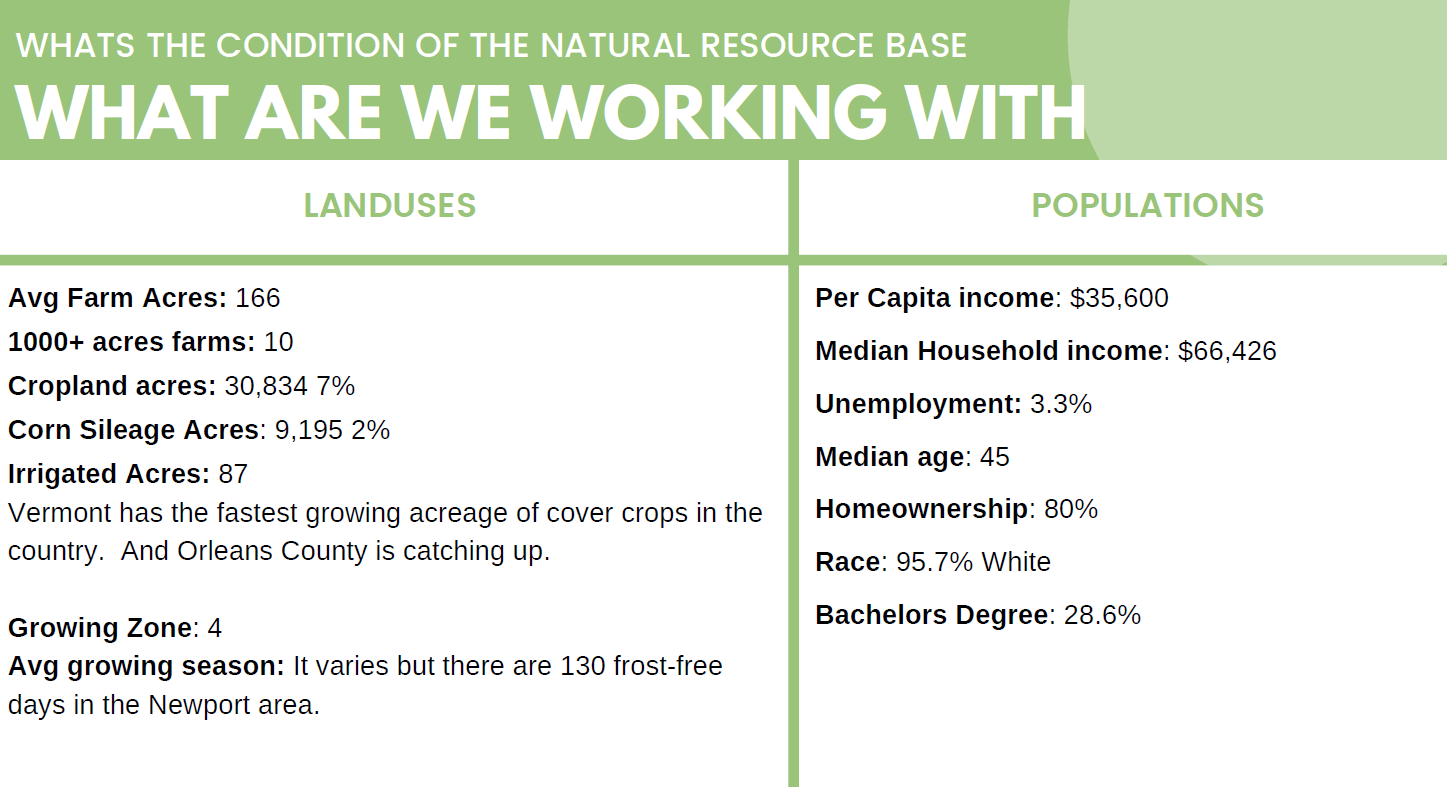
--10 farms with over 1000 is a good group to know and prioritize. It is a Strategic objective of the OCNRCD to work with Large Farms and Annual Crop Growers that manage 2% of the ag land in the county.
-- We have a short and challenging growing season... can make conservation adaptations challenging in an already challenging ag industry.
Populations:
-- We need to do a better job connecting to the 5% non white.
-- Homeownership at 80% -- that's a lot of folks who likely also own land and who make land management decisions.
-- Education Level - conservation professionals and planners need to consider this in community engagement work.
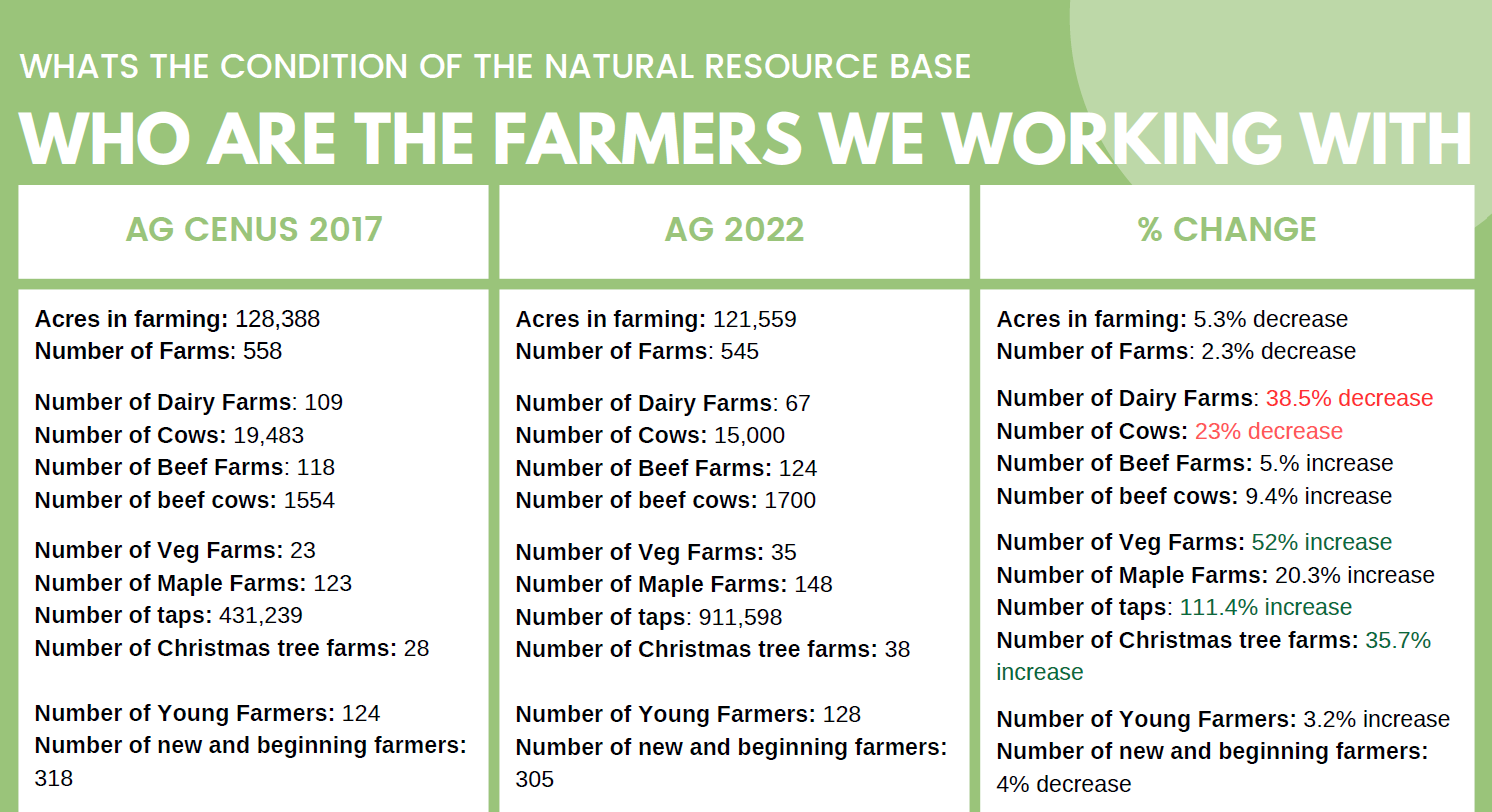
Points that stand out:
Note the % change
-- Less dairies - we know
-- more veg - exciting
--more taps- technology advancement
-- We belive there are more new and small farms than these number capture. NOTE: this data is form the ag census data for a five year time span...
Note the % change
-- Less dairies - we know
-- more veg - exciting
--more taps- technology advancement
-- We belive there are more new and small farms than these number capture. NOTE: this data is form the ag census data for a five year time span...